-
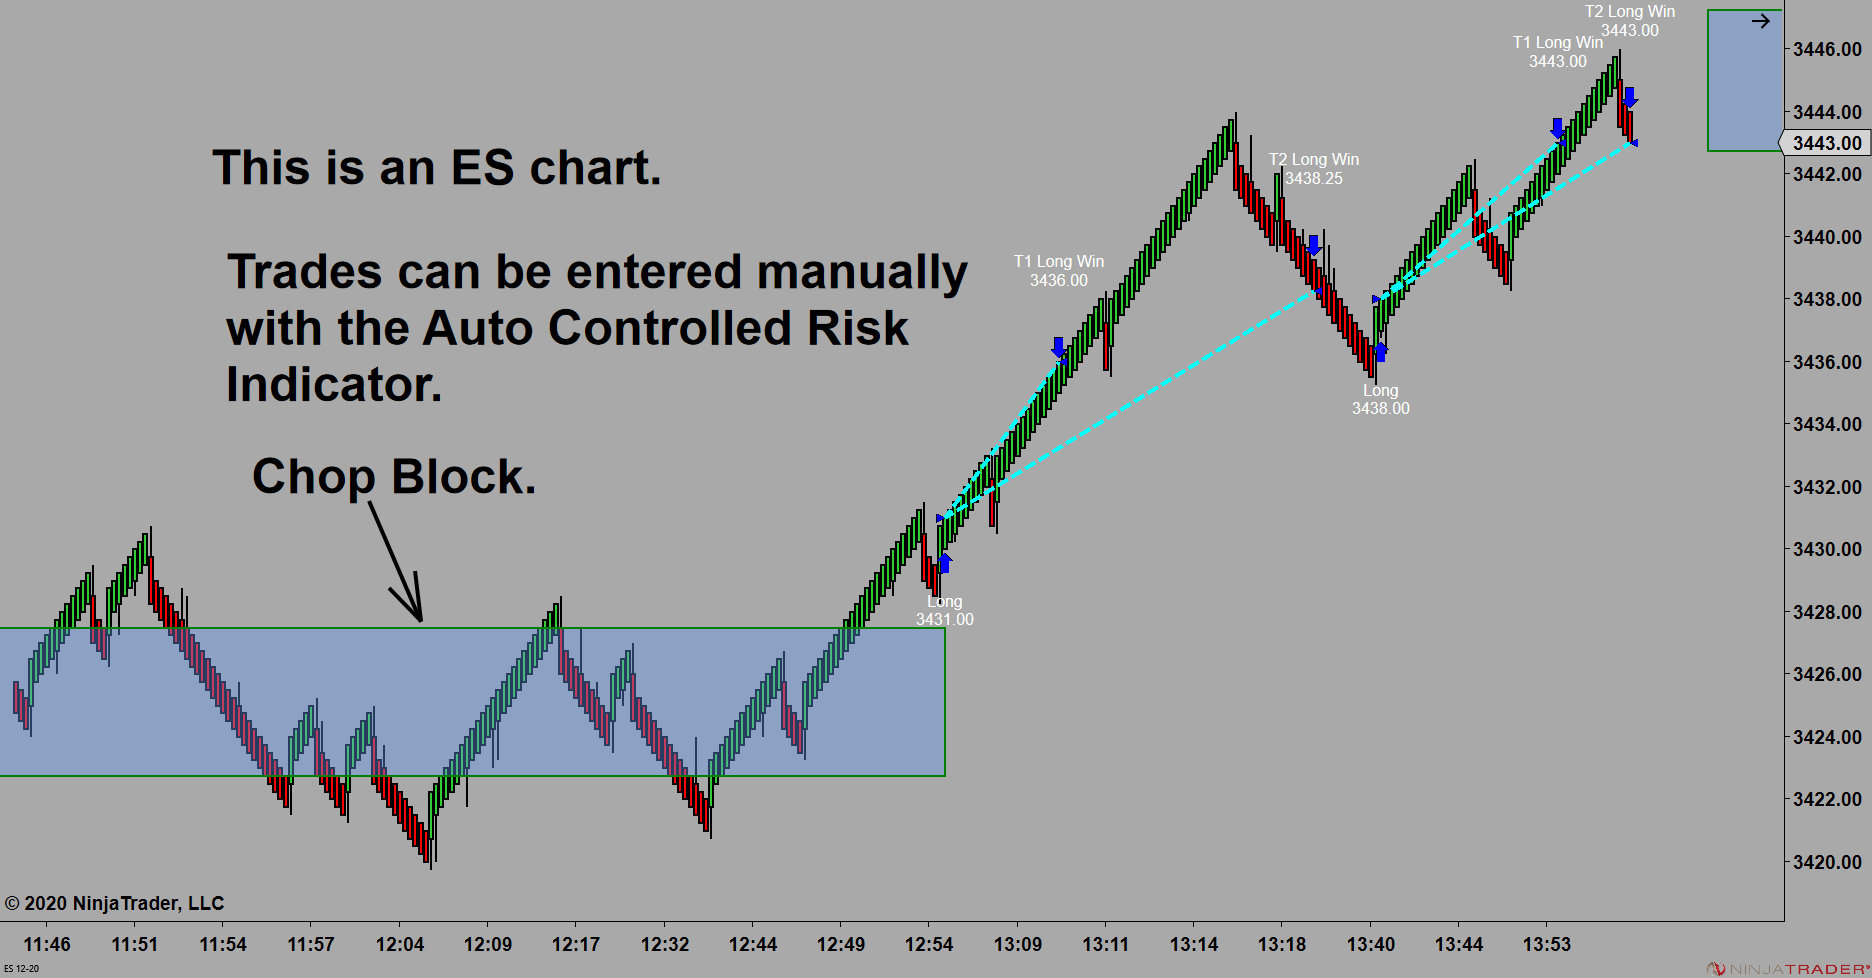
Chart #1 - Auto Controlled Risk Indicator
Chart #1 shows trades automatically generated by Auto Controlled Risk Indicator, which is used to manually enter and exit the trades. The indicator will generate the same trades as the strategy. Next Chart »
More Details... Request Live Session Demo -
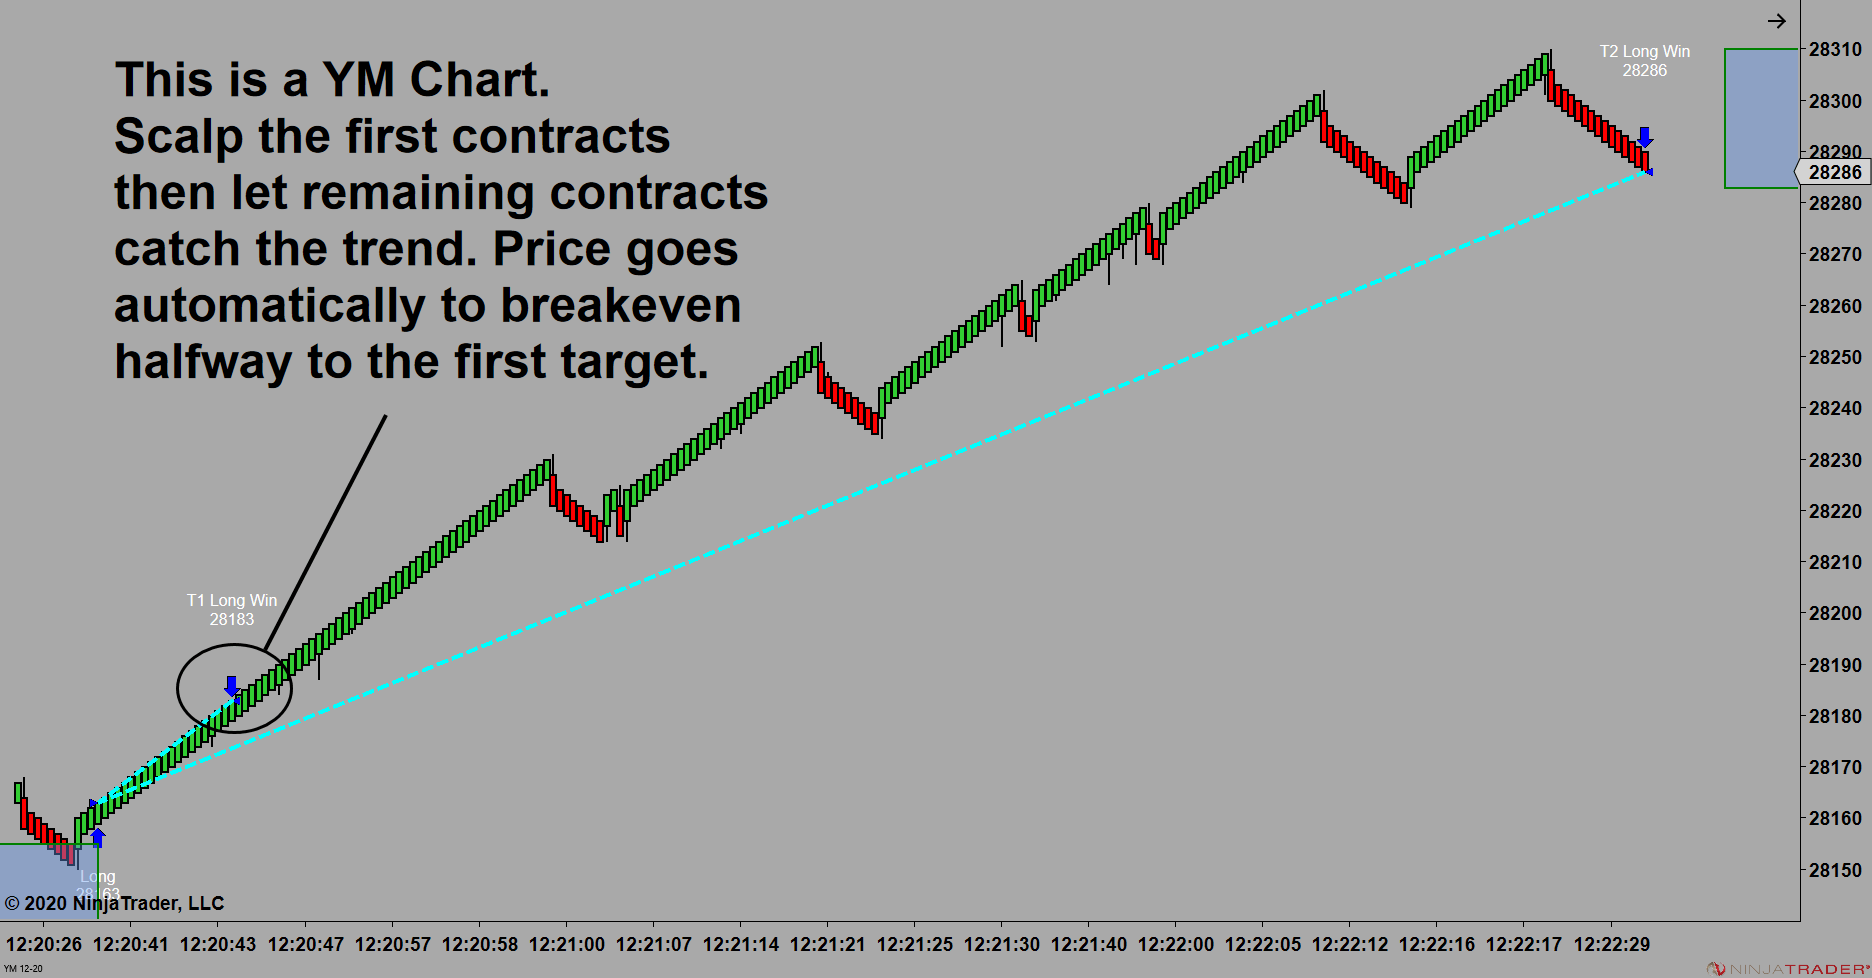
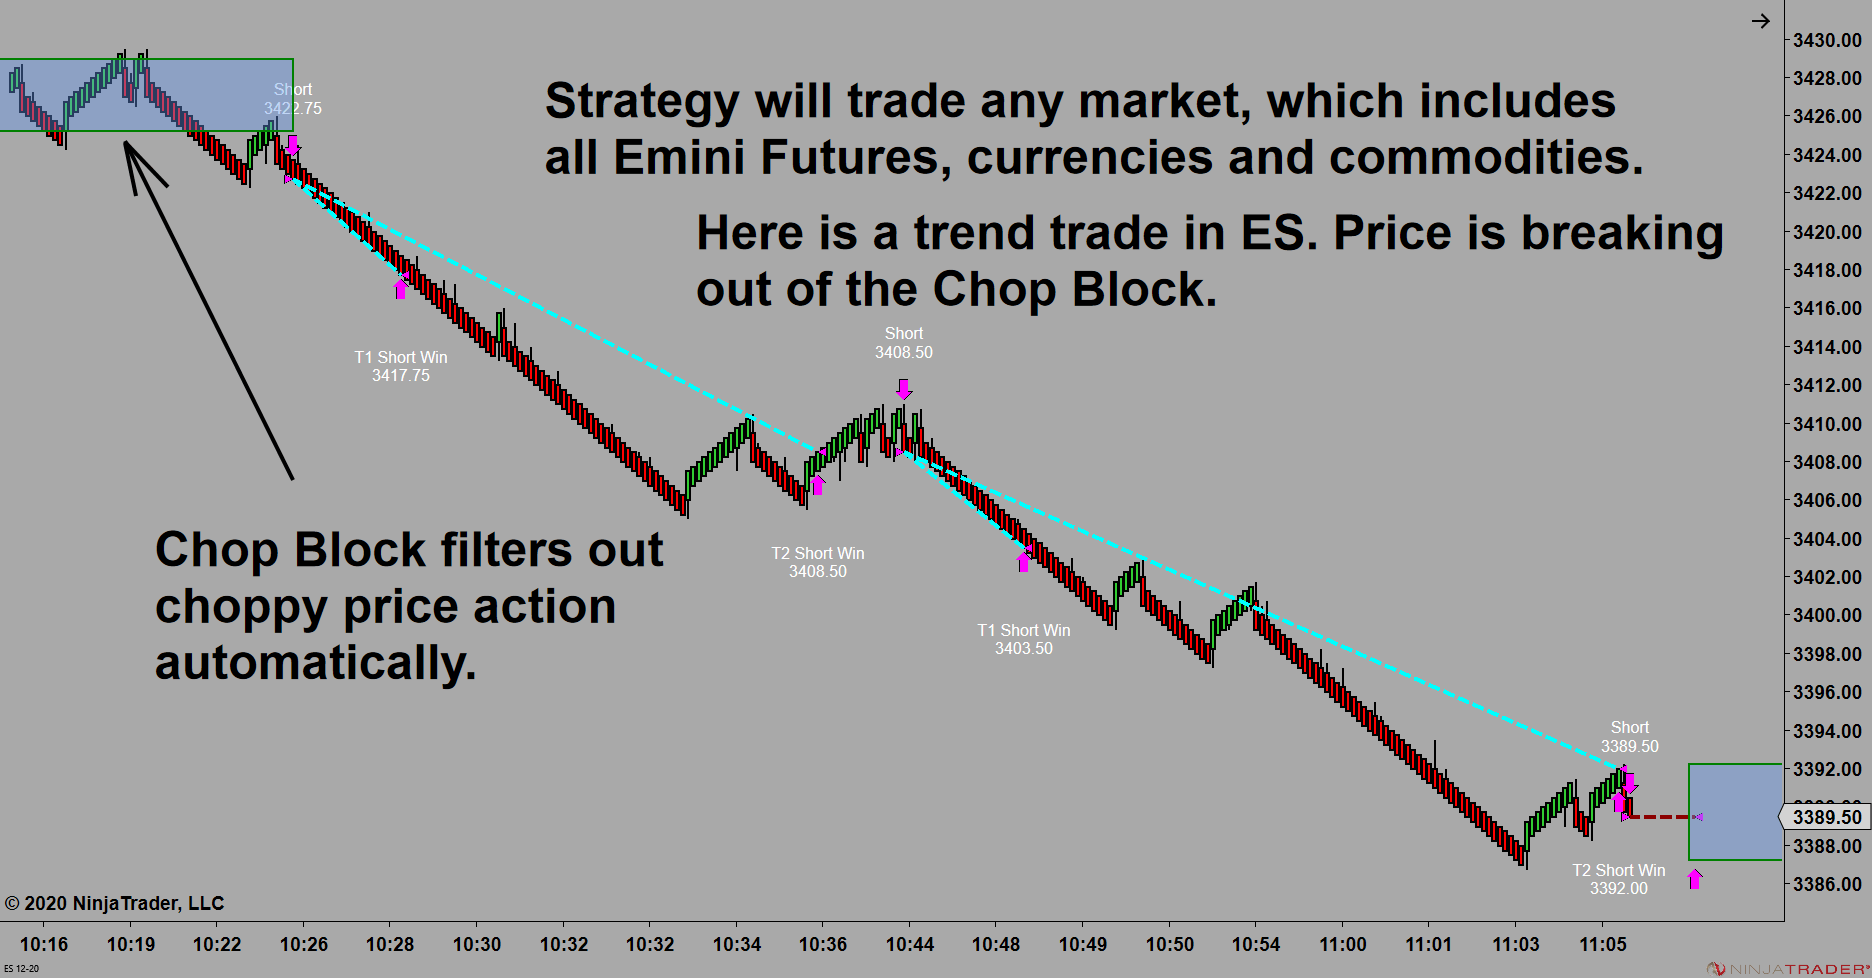
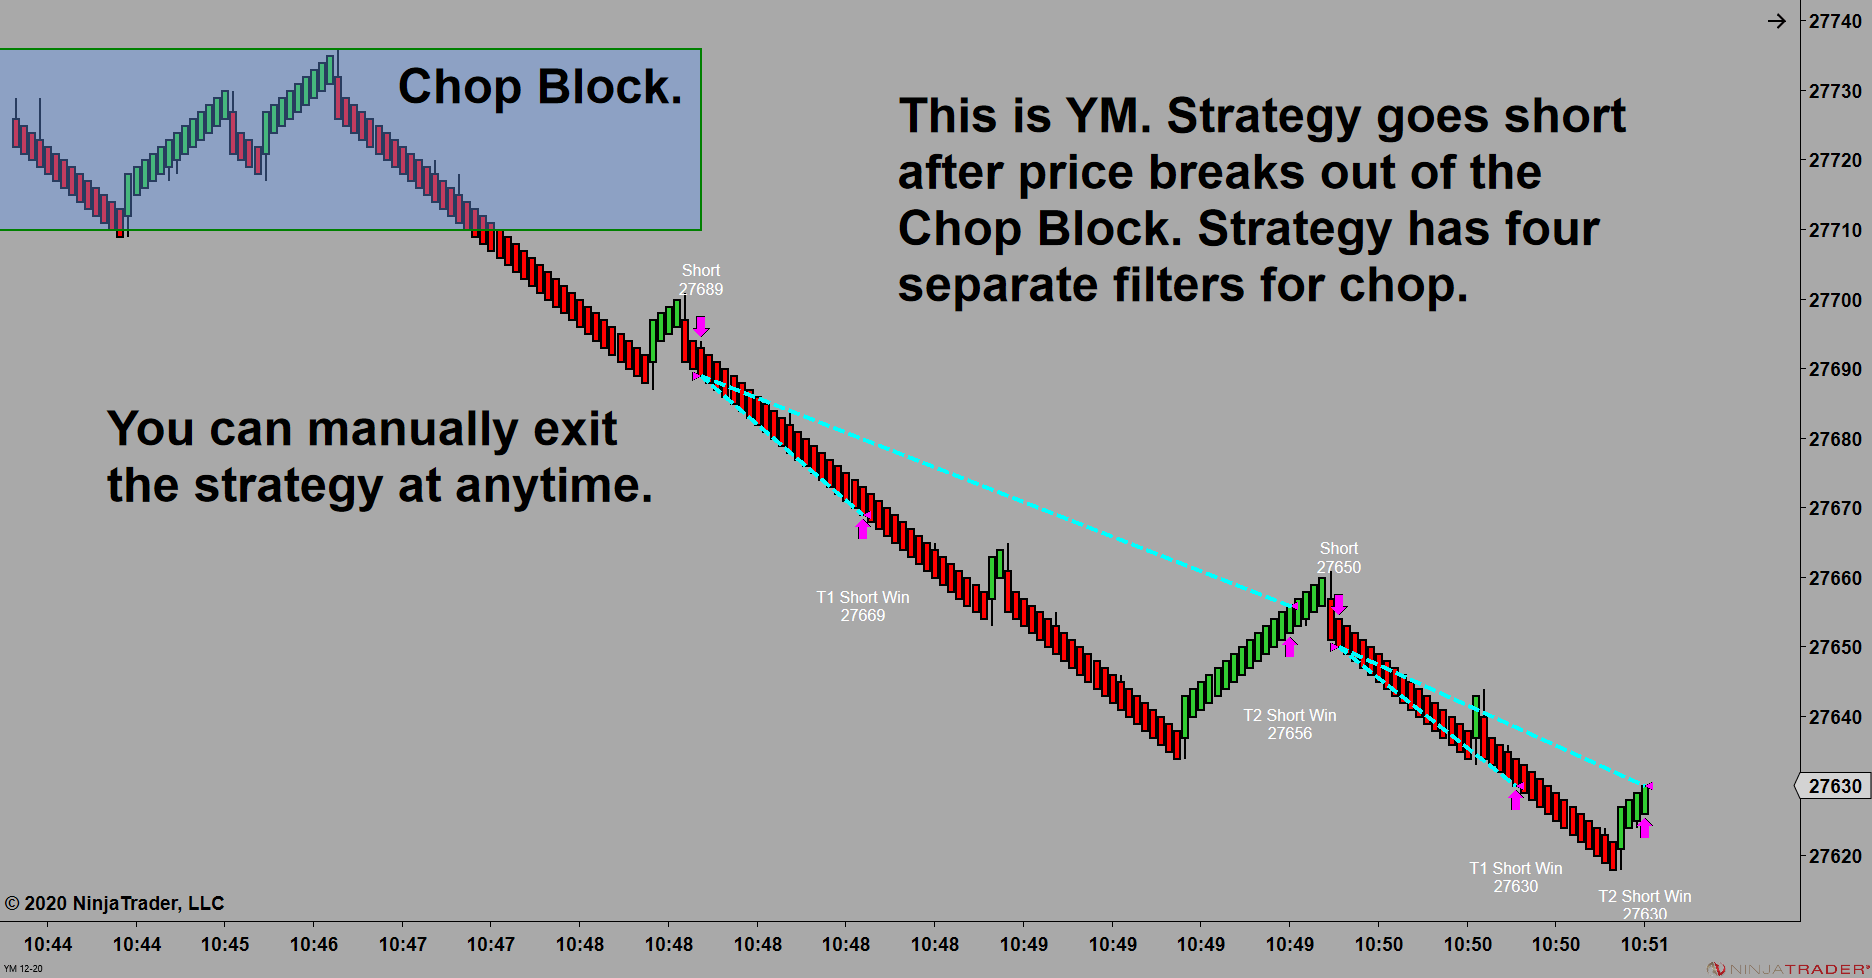
Chart #2 - Trending Trades
You enter the trade as a scalp to be on-board if price starts to trend as shown on chart #2. Once you hit the first target, the protective stop will automatically go to breakeven and you let the remaining contracts run to catch a potential trend. Next Chart »
More Details... Request Live Session Demo -
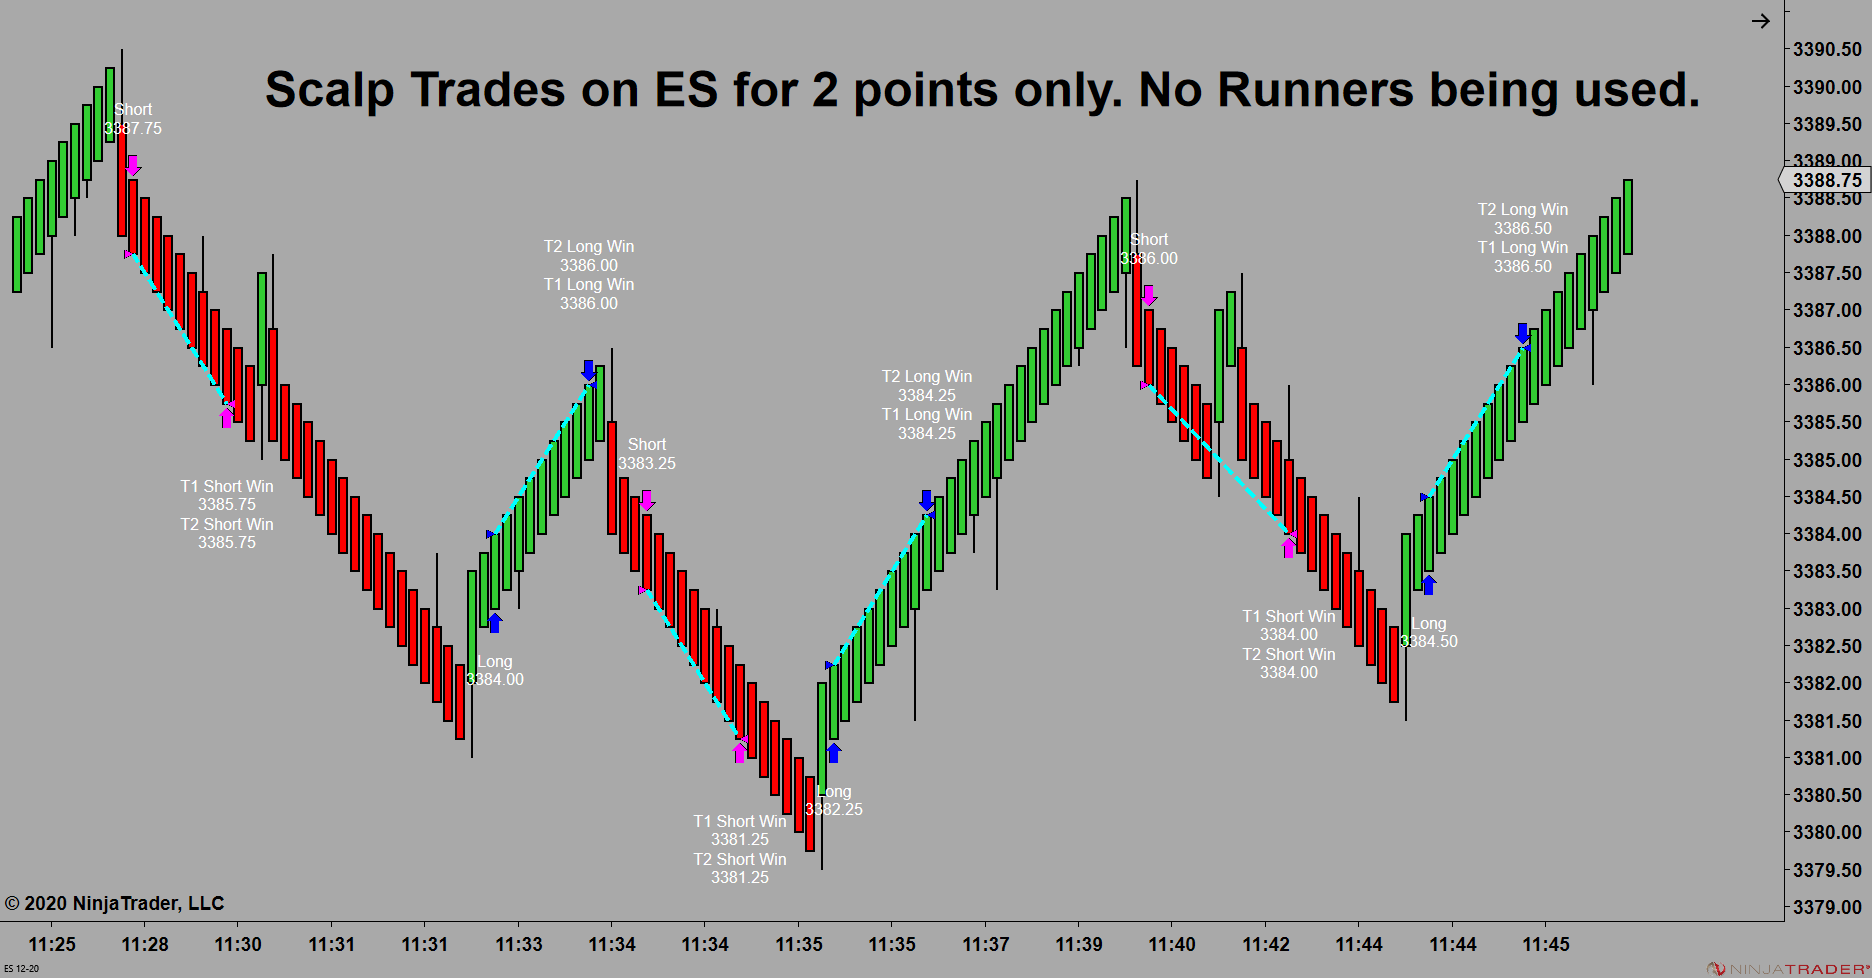
Chart #3 - Scalping Trades
The ES chart on the right shows scalping trades for 2 points. As you can see there are many scalping trades and many winners, but I like to let the Runners run as I trail the protective stop. If price starts to trend, I’m on-board for the big move. However, some traders only want to scalp and they go for many small profits with multiple contracts. Next Chart »
More Details... Request Live Session Demo
DAY TRADE USING MY AUTOMATED STRATEGY AND INDICATORS ON NINJATRADER 8 TO AUTOMATICALLY OR
MANUALLY ENTER AND EXIT TRADES.
Conway Market DNA Day Trading System comes with 250 page manual that explains how everything works.
Automatic Entries and Exits
The Controlled Risk Entry Trading Strategy can be used to automatically enter and exit trades in any futures market. That includes currencies, such as the Euro, Japanese Yen, British Pound, etc. and commodities such as oil, soy beans, corn, etc.
You're In Control
Once the Auto Controlled Risk strategy enters the trade, you can choose to do nothing other than sit back and watch the trade unfold, OR you can manually control the trade. Additionally, you can enter and exit a trade manually without a strategy using the Auto Controlled Risk Indicator which gives audio and visual signals.
Targets and Stops
All trades start as a scalp with the first target. Once the first target is hit, you can go to breakeven on the initial contracts with the remaining contracts being used as Runners.
Identifies Trade Locations
The Controlled Risk Entry Strategy and Indicator will help identify good trade locations plus, there are a dozen other indicators that can help identify good trade locations. Those include Buy/Sell Zones for possible reversal areas, a Point of Control indicator that is a simplified version of Order Flow and also prints potential targets on the screen, Modified Renko Bars that make trending easier to see, plus other indicators you may find helpful for trade locations.